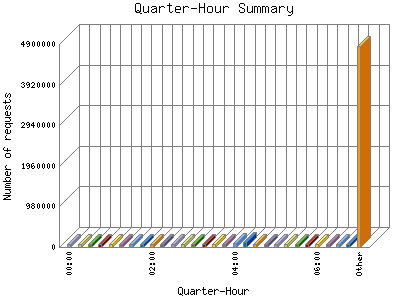
The Quarter-Hour Summary shows an overview of site activity over the course of a day, broken down into fifteen-minute intervals. If your report has enough traffic this will give you a detailed graph of your site's load throughout the day.
| Quarter-Hour | Number of requests | Percentage of the requests | |
|---|---|---|---|
| 1. | 00:00 | 70,479 | 1.2% |
| 2. | 00:15 | 71,963 | 1.4% |
| 3. | 00:30 | 70,238 | 1.2% |
| 4. | 00:45 | 66,256 | 0.97% |
| 5. | 01:00 | 72,877 | 1.7% |
| 6. | 01:15 | 68,404 | 0.100% |
| 7. | 01:30 | 70,528 | 1.2% |
| 8. | 01:45 | 65,867 | 0.96% |
| 9. | 02:00 | 70,491 | 1.2% |
| 10. | 02:15 | 67,344 | 0.99% |
| 11. | 02:30 | 66,686 | 0.98% |
| 12. | 02:45 | 67,542 | 0.99% |
| 13. | 03:00 | 71,071 | 1.3% |
| 14. | 03:15 | 65,087 | 0.94% |
| 15. | 03:30 | 69,639 | 1.1% |
| 16. | 03:45 | 67,136 | 0.98% |
| 17. | 04:00 | 90,977 | 1.32% |
| 18. | 04:15 | 110,348 | 1.60% |
| 19. | 04:30 | 79,096 | 1.16% |
| 20. | 04:45 | 68,440 | 0.100% |
| 21. | 05:00 | 71,544 | 1.4% |
| 22. | 05:15 | 71,248 | 1.3% |
| 23. | 05:30 | 70,534 | 1.2% |
| 24. | 05:45 | 69,442 | 1.1% |
| 25. | 06:00 | 71,270 | 1.3% |
| 26. | 06:15 | 80,694 | 1.18% |
| 27. | 06:30 | 77,578 | 1.12% |
| 28. | 06:45 | 75,965 | 1.10% |
| 29. | 07:00 | 78,136 | 1.13% |
| 30. | 07:15 | 76,343 | 1.11% |
| 31. | 07:30 | 81,445 | 1.19% |
| 32. | 07:45 | 76,530 | 1.11% |
| 33. | 08:00 | 74,680 | 1.9% |
| 34. | 08:15 | 74,939 | 1.10% |
| 35. | 08:30 | 74,953 | 1.10% |
| 36. | 08:45 | 70,830 | 1.3% |
| 37. | 09:00 | 77,159 | 1.12% |
| 38. | 09:15 | 74,659 | 1.9% |
| 39. | 09:30 | 78,844 | 1.14% |
| 40. | 09:45 | 69,589 | 1.1% |
| 41. | 10:00 | 68,569 | 0.100% |
| 42. | 10:15 | 72,575 | 1.6% |
| 43. | 10:30 | 69,422 | 1.1% |
| 44. | 10:45 | 65,023 | 0.94% |
| 45. | 11:00 | 78,216 | 1.13% |
| 46. | 11:15 | 77,871 | 1.13% |
| 47. | 11:30 | 79,316 | 1.16% |
| 48. | 11:45 | 70,214 | 1.2% |
| 49. | 12:00 | 79,214 | 1.16% |
| 50. | 12:15 | 73,583 | 1.8% |
| 51. | 12:30 | 70,385 | 1.2% |
| 52. | 12:45 | 67,262 | 0.98% |
| 53. | 13:00 | 66,897 | 0.98% |
| 54. | 13:15 | 69,155 | 1% |
| 55. | 13:30 | 69,580 | 1.1% |
| 56. | 13:45 | 72,331 | 1.6% |
| 57. | 14:00 | 74,118 | 1.8% |
| 58. | 14:15 | 73,010 | 1.7% |
| 59. | 14:30 | 73,096 | 1.7% |
| 60. | 14:45 | 68,565 | 0.100% |
| 61. | 15:00 | 74,312 | 1.9% |
| 62. | 15:15 | 74,869 | 1.10% |
| 63. | 15:30 | 71,787 | 1.4% |
| 64. | 15:45 | 71,206 | 1.3% |
| 65. | 16:00 | 71,535 | 1.4% |
| 66. | 16:15 | 83,905 | 1.22% |
| 67. | 16:30 | 63,168 | 0.92% |
| 68. | 16:45 | 62,011 | 0.90% |
| 69. | 17:00 | 66,558 | 0.97% |
| 70. | 17:15 | 75,923 | 1.10% |
| 71. | 17:30 | 71,203 | 1.3% |
| 72. | 17:45 | 68,698 | 1% |
| 73. | 18:00 | 68,384 | 0.100% |
| 74. | 18:15 | 76,679 | 1.11% |
| 75. | 18:30 | 71,739 | 1.4% |
| 76. | 18:45 | 70,062 | 1.2% |
| 77. | 19:00 | 71,562 | 1.4% |
| 78. | 19:15 | 66,685 | 0.98% |
| 79. | 19:30 | 68,374 | 0.100% |
| 80. | 19:45 | 71,896 | 1.4% |
| 81. | 20:00 | 67,707 | 0.99% |
| 82. | 20:15 | 65,971 | 0.97% |
| 83. | 20:30 | 63,426 | 0.92% |
| 84. | 20:45 | 64,040 | 0.93% |
| 85. | 21:00 | 64,752 | 0.94% |
| 86. | 21:15 | 70,670 | 1.2% |
| 87. | 21:30 | 68,153 | 0.100% |
| 88. | 21:45 | 63,154 | 0.91% |
| 89. | 22:00 | 65,666 | 0.96% |
| 90. | 22:15 | 66,492 | 0.97% |
| 91. | 22:30 | 63,754 | 0.92% |
| 92. | 22:45 | 60,354 | 0.88% |
| 93. | 23:00 | 68,789 | 1% |
| 94. | 23:15 | 68,510 | 0.100% |
| 95. | 23:30 | 70,496 | 1.2% |
| 96. | 23:45 | 70,978 | 1.3% |
This report was generated on March 13, 2025 01:39.
Report time frame August 28, 2016 04:27 to March 12, 2025 04:59.
| Web statistics report produced by: | |
 Analog 5.24 Analog 5.24 |  Report Magic for Analog 2.13 Report Magic for Analog 2.13 |